Raman spectroscopy
Characterisation Installation 5
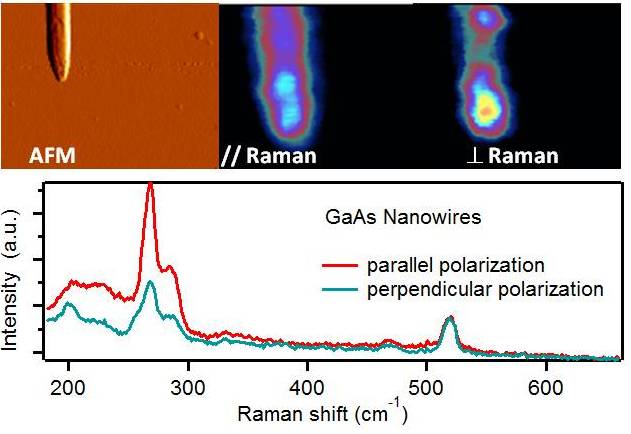
The Raman effect is observed when monochromatic light couples with molecular rotovibrational or crystal vibrational excitations in the sample under investigation. Some of the photons transfer a tiny amount of energy to the oscillating atoms, and the color of the scattered light is slightly redshifted. Although this effect was first observed by naked eye by sir C.V. Raman in 1928, is indeed very elusive. However, today, with the advent of highly monochromatic and high power laser sources and high resolution spectrometers, it gained a widespread diffusion for a large range of applications. Since the roto-vibrational information is specific to the chemical bonds and the symmetry of the molecules or of the crystal, the Raman spectrum provides a fingerprint by which the sample can be characterized with an incredible precision. For instance, the sample orientation with respect to the surface, cis or trans configuration of an organic molecule, or the wurzite vs zincblende structure of a crystal can be obtained. Single layer graphene, bilayer graphene, graphene oxide and graphite share the same composition and the same general structure but their Raman spectra differ significantly.
The outstanding properties of Raman spectroscopy came to a price: usually Raman signal is disarmingly low. To circumvent this issue, strategies based on the plasmonic enhancement of the local electromagnetic field were proposed: with SERS (Surface Enhanced Raman Spectroscopy) amplification of the Raman signal up to 1014 times were shown; with TERS (Tip Enhanced Raman Scattering) spatial resolution down to 7nm was obtained. Choosing an excitation wavelength corresponding to an electric transition in the sample, Resonant Raman (SERRS) can be performed with a further enhancement in signal.
WARNING: Access to CNRS temporarily not available, but the technique is available at the other sites
Micro-Raman
Chemical composition determination, crystalline structure characterisation, strain calculation, non-destructive fast measurements on liquids or solids
Multiple laser sources with optical power at the sample between 0.1 and 10 mW are focused on the sample using a confocal microscope

